Tag: Maths

Statistics Investigation – Maths Strand

LI: to read the text, gather, sort, graph, and analyse the data.
LI: to understand the meaning of Mode, Median, Mean

For our task we made a statistical investigation about our blog posts over the years. (Year 7 was 2021 – 2023 and Year 8 was 2020 – 2023.) We went on our old blogs and counted each blog post we did in each month. For example: in March 2021 I blog 11 posts. Other way of learning statistical investigation is learning the meaning of: Mean, Median, and Mode:

The Meaning of Mean is: the total of the group of numbers.
The Meaning of Mode is: seeing the most appeared number in the group of numbers. For example: if there is 11, 12, 13, 15, 12, 11, the most appearing number is 12 because it apppear 3 times in the group.
The Meaning of Median is: finding the middle number in the group, but first putting it from smallest to largest and then finding the middle number.

I enjoyed this task because I learnt how to make a bar graph for my investigation. My favourite part in the statistical investigation is looking at my old blogs and comparing it to my recent blogs.
Statistical Investigation

LI: To read the text, gather sort, graph and analyse the data

Our maths group created a diagram which shows the top six rivers in Auckland from smallest to largest. We used our collaborative skills to find out the data of each river. We put these rivers in this order from shortest to longest: Whanau River 5.7 km , Puhoi River 13 km , Tamaki River  15km, Waitakere River 16km, Hoteo River 28 km, and Waiora River 65 km. We used our knowledge to come to the conclusion on what river is the longest out of the 6 rivers in Auckland, which is Waiora 65 km (kilometers).

I found this activity interesting because I never knew that one of the rivers in Auckland was 65 km. This was also challenging because I didn’t know what the y axis and x axis mean in statistics.

Basic Facts Boxes

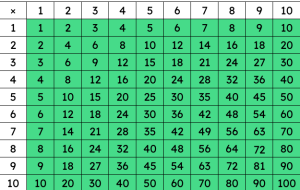
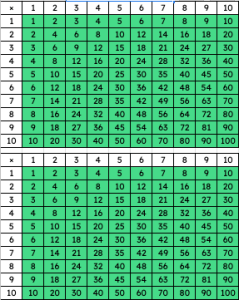
I completed a basic facts, multiplication in order.

The purpose of the basic facts boxes is to increase my speed on typing the answers and gathering the knowledge of our basic facts to improve on what to do.

Next I chose multiplication in ordered, so I can see my results and if I have to improve in my time or how fast I can type the answers.

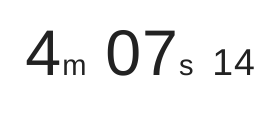
My time was 4 minutes and 7 secounds. My goal for next time is to type faster than before. To achiev this I will need to practise at home.

Basic Facts

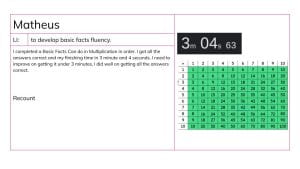
I completed a Basic Facts Can do in Multiplication in order. I got all the answers correct and my finishing time in 3 minute and 4 seconds. I need to improve on getting it under 3 minutes, I did well on getting all the answers correct.


Maths – Temperature

I learnt what temperatures are measured in and what the definition of raise and fall is.

First I learnt the definition of rise and fall. The definition of raise is: telling that the temperature is going to rise up, so that means that the temperature is going to become hotter. The definition of fall is: telling that the temperature is starting to become colder.

Next I learnt how the people measure the weather. They can be measured by air. The hottest country is Mali. The temperature can go up to 83.93F. This is located in West Africa. This is listed in the top 10 most hottest countries. There are many countries that are cold, but the coldest country is Antarctica. On July 21 1983 Antarctica was -89.2 degrees. This made the country the coldest country in the world.

I enjoyed this task because I learnt new things about temperature. I need to improve on finding another country that is cold. I did well on finding the hottest country.

Maths – Measuring Time

I learnt how to measure time. I also learnt the two times.

First I learnt two different times. Digital time and analog time. These two times are different because digital time is on a type of technology like: netbooks, phones, and other technology. Analog time can be used as a real clock. 

Next I put a random time to measure. For example: if digital time was 7:40, then the analog time would be 20 minutes to 7 hours. I learnt the hands of the clock. For example: the long hand is the minute hand. The short hand is the hour hand.

I enjoyed this task because I learnt two different types of time. I need to improve on finding out the hour hand. I did well on guessing the minute hand.

Basic Facts

I completed a Basic Facts Can do in Multiplication in order. I got all the answers correct and my finishing time in 3 minute and 4 seconds. I need to improve on getting it under 3 minutes, I did well on getting all the answers correct.

Basic Facts Boxes

I learnt my basic facts for times tables.

First I practised my 1 – 5 time tables. For example: I need 1 x 1 – 1 x 10, 5 x 1 – 5 x 10. This was easy because I remembered my times tables up to 5.

Next I practised my 6 – 12 time tables. For example: I need to 6 x 1 – 6 x 10, 12 x 1 – 12 x 10. This was hard because I didn’t know my 12 times table.

I enjoyed this task because I practised my times tables. I need to improve on my 12 times tables. I did well on my 5 times tables.

Maths – Statistics Length

I learnt how to make a statistics on jumping to a distance.

First we leant how to make a table and a scatter graph. A scatter graph has dots on where the score is placed at. For example: if I jump 2.921 mm I have to convert it into metres, so the number will be 2.9 cm / 2.92 cm.

Next we had to jump 8 times. My lengths for my jump went high and low. For example: my longest jump was 2.8 cm and my lowest was 1.8 cm. That was my lowest jump because I started to get tired.

I enjoyed this task because I learnt how to make a scatter graph. I need to improve on making the graph. I did well on jumping. 


Maths – Perimetre

I learnt how to measure in perimetre.

First we learnt what to measure the objects in.  The length for the mat is 1 metre, 46 centre . The width for the mat is 86 centimetres. Then we had to add it up. For example: 1 metre + 1 metre = 2 metres, 46 centimetre + 46 centimetre = 92 centimetres, 2 metres + 92 centimetres = 2.92, 86 centimetres + 86 centimetres = 1.72 metres, so 1.72 + 2.92 = 4 metres, and 64 centimetres.

Next we learnt what perimetre is. Perimetre is measuring the outline of the area, not the inside of the area. For example: our class mat is measured in cm (centimetre). We measured our school field. The measurement for the school field is 201 metres. Our guess was 295.33 – 450 metres. We were 11 metres off.

I enjoyed this task because I learnt a new strategy. I need to improve on making the shape for our school field. I did well on guessing the perimetre for our school field.